Table of Contents
- Overview
- Requirements
- File Tree
- Create a Cluster
- Install Flux Controllers
- Create a Secret for Authenticating to the GitHub Repository
- Connect Flux to the Repository
- Target the KWOK Manifests using Flux
- Apply Custom Resources (CRs) of Stages
- Target the Deployment and Node YAML Manifests using Flux
- Install Prometheus and Grafana
- Enable Metrics on Kube-Scheduler
- Grab the Grafana Username and Password
- Scale the Deployment to 30 and Modify Node Affinity
- View Scheduler Metrics on Grafana Dashboard
- Conclusion
Overview
So, I have been studying the GitOps associate exam, I decided to document my learning by implementing it on an open-source project I worked on during my past internship experience at DaoCloud.
DaoCloud has an open-source project called Kubernetes without Kubelet (KWOK) which helps developers who are building products on Kubernetes, test their Kubernetes control plane. They do this by creating a huge amount of pods or nodes to stress test the control plane. Since running such tests in a real environment is expensive, KWOK makes this cost-effective.
I haven’t found any resource on the internet showing users how to deploy this using Flux, a GitOps tool, and monitoring the Kubernetes scheduler using Prometheus, this article should help.
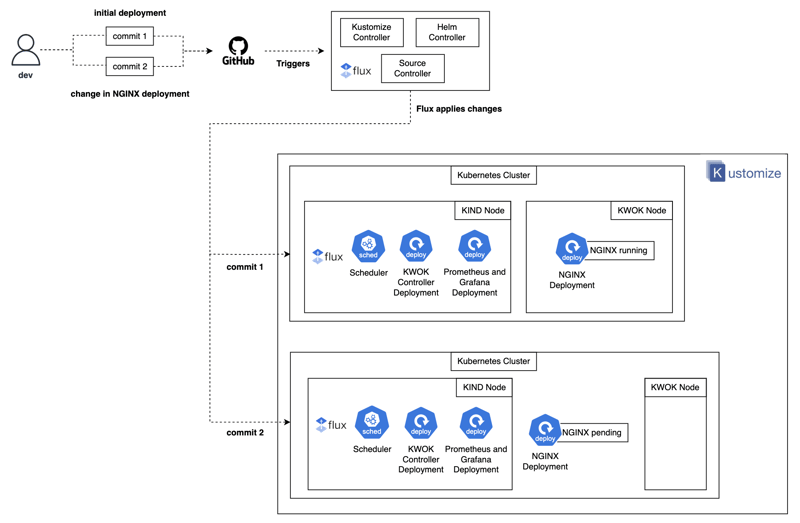
High-level architecture of a KWOK deployment using GitOps
It’s also worth mentioning that I found a KWOK documentation bug and opened a PR that got merged while I was preparing for this article.
Requirements
File Tree
├── cluster.yaml
├── gitops
│   ├── flux
│   │   ├── git.yaml
│   │   ├── kwok.yaml
│   │   └── others.yaml
│   │   └── prometheus-grafana.yaml
│   └── kustomization
│       ├── kwok
│       │   ├── base
│       │   │   ├── kustomization.yaml
│       │   │   └── namespace.yaml
│       │   └── overlays
│       │       └── kustomization.yaml
│       └── others
│           ├── base
│           │   ├── deployment.yaml
│           │   ├── kustomization.yaml
│           │   ├── namespace.yaml
│           │   └── node.yaml
│           └── overlays
│               └── modify-number-of-pods
│                   ├── deployment.yaml
│                   └── kustomization.yaml
└── secrets.yaml
We will be working with a few files, so this tree will guide us through it.
Breaking it into sections:
-
gitops/flux/→ Flux configurations -
gitops/kustomization/kwok/→ KWOK setup using Kustomize -
gitops/kustomization/others/→ Additional Kubernetes resources -
secrets.yaml→ Holds authentication credentials
Create a Cluster
The first step is to create a real Kubernetes cluster. KWOK will be deployed into the cluster. Here I will be using a Kubernetes in Docker (KIND) cluster.
kind create cluster --config cluster.yaml
cluster.yaml
kind: Cluster
apiVersion: kind.x-k8s.io/v1alpha4
nodes:
  - role: control-plane
    extraPortMappings:
      - containerPort: 30000 # The k8s service port for grafana
        hostPort: 3000 # The host port you want to expose the k8s service
        protocol: TCP
      - containerPort: 30909 # The k8s service port for prometheus
        hostPort: 9090 # The host port you want to expose the k8s service
        protocol: TCP
The cluster.yaml file configures port mappings that allow the host to access the Grafana and Prometheus services once they are deployed into the Kind cluster for observability.
Install Flux Controllers
Flux is a GitOps tool that takes the infrastructure code defined in a Git repository and automatically deploys them into a Kubernetes cluster. It also watches for changes in the repository, and synchronizes those changes in the cluster.
All these interactions are handled by the controllers.
flux install

kubectl get pod -n flux-system

NAME                                       READY   STATUS    RESTARTS        AGE
helm-controller-5bb6849c4f-rbrrj           1/1     Running   1               5m
kustomize-controller-68597c4488-9vtnl      1/1     Running   1               5m
notification-controller-7d6f99878b-plvzl   1/1     Running   1               5m
source-controller-666dc49455-z4gs7         1/1     Running   1               5m
Create a Secret for Authenticating to the GitHub Repository
Flux needs to authenticate to your repository because this repository may be private.
echo -n "testing" | base64
echo -n "testing1234" | base64
Your username and password need to be converted to base64. The result will be specified as the value.
secrets.yaml
apiVersion: v1
kind: Secret
metadata:
  name: github-auth
  namespace: flux-system
type: Opaque
data:
  username: dGVzdGluZw==
  password: dGVzdGluZzEyMzQ=
kubectl apply -f secrets.yaml
Connect Flux to the Repository
├── gitops
├── flux
│   │   ├── git.yaml
│   │   ├── kwok.yaml
│   │   └── others.yaml

kubectl apply -f gitops/flux/git.yaml
flux/git.yaml
apiVersion: source.toolkit.fluxcd.io/v1
kind: GitRepository
metadata:
  name: git
  namespace: flux-system
spec:
  interval: 1m # Syncs to the repo every 1 minutes
  url: https://github.com/network-charles/kwok-gitops.git
  ref:
    branch: main
  secretRef:
    name: github-auth
For real-world production workloads, a longer interval (e.g., 5-10 minutes) is recommended to reduce API rate limits and unnecessary sync attempts.
Target the KWOK Manifests using Flux
When working with Flux, you can use a tool called Kustomize to place your main configs in a base directory, and then modify any of these configs using a copy placed in an overlays directory. It’s preferable this way than messing with your main config.
├── gitops
│     ├── flux
│     │   │   └── kwok.yaml
│       └── kustomization
│       ├── kwok
│       │   ├── base
│       │   │   ├── kustomization.yaml
│       │   │   └── namespace.yaml
│       │   └── overlays
│       │       └── kustomization.yaml

kubectl apply -f gitops/flux/kwok.yaml
flux/kwok.yaml
apiVersion: kustomize.toolkit.fluxcd.io/v1
kind: Kustomization
metadata:
  name: kwok
  namespace: flux-system
spec:
  interval: 1m # Syncs to the repo every 1 minutes
  targetNamespace: kwok
  sourceRef:
    kind: GitRepository
    name: git
    namespace: flux-system
  path: "/gitops/kustomization/kwok/overlays"
  prune: true
  timeout: 1m # time it takes for the manifest to finish applying before timing out
Flux targets the directory/path containing the file I will use to deploy KWOK into my cluster.
The manifest below is the targeted file. I am attempting to modify the image version used to deploy KWOK into my cluster. Since I am already referencing the base directory via the resources field, Flux will create everything there first, afterward, it’d modify any image version changes I specify in the patches and images fields.
kustomization/overlays/kustomization.yaml
apiVersion: kustomize.config.k8s.io/v1beta1
kind: Kustomization
resources:
  - ../base
patches:
  - target:
      kind: Kustomization
    patch: |-
      apiVersion: kustomize.config.k8s.io/v1beta1
      kind: Kustomization
      metadata:
        name: kwok
        namespace: kwok
      resources:
        - https://github.com/kubernetes-sigs/kwok/kustomize/kwok?ref=v0.5.1
images:
  - name: registry.k8s.io/kwok/kwok
    newTag: "v0.5.1"
Apply Custom Resources (CRs) of Stages
This makes it possible to simulate the state of a pod or node in the cluster with very little resources.
KWOK_REPO=kubernetes-sigs/kwok
KWOK_LATEST_RELEASE=$(curl "https://api.github.com/repos/${KWOK_REPO}/releases/latest" | jq -r '.tag_name')
kubectl apply -f "https://github.com/${KWOK_REPO}/releases/download/${KWOK_LATEST_RELEASE}/stage-fast.yaml"
Target the Deployment and Node YAML Manifests using Flux
├── gitops
│     ├── flux
│     │   │  └── others.yaml
│     └── kustomization
│       └── others
│           ├── base
│           │   ├── deployment.yaml
│           │   ├── kustomization.yaml
│           │   ├── namespace.yaml
│           │   └── node.yaml
│           └── overlays
│               └── modify-number-of-pods
│                   ├── deployment.yaml
│                   └── kustomization.yaml

kubectl apply -f gitops/flux/others.yaml
Now all manifests in this others directory will be managed by Flux.
gitops/flux/others.yaml
apiVersion: kustomize.toolkit.fluxcd.io/v1
kind: Kustomization
metadata:
  name: others
  namespace: flux-system
spec:
  interval: 1m # Syncs to the repo every 1 minutes
  sourceRef:
    kind: GitRepository
    name: git
    namespace: flux-system
  path: "/gitops/kustomization/other/overlays/modify-number-of-pods"
  prune: true
  timeout: 1m
Notice how the
overlaysdirectory is still been referenced, and used to make changes to the main deployment.
Install Prometheus and Grafana
This deploys Prometheus and Grafana using Helm, but it’s managed by Flux. I like this because, I don’t need to manage Helm manually using the command line.
prometheus-grafana.yaml
apiVersion: source.toolkit.fluxcd.io/v1
kind: HelmRepository
metadata:
  name: prometheus-community
  namespace: flux-system
spec:
  interval: 1m
  url: https://prometheus-community.github.io/helm-charts
---
apiVersion: helm.toolkit.fluxcd.io/v2
kind: HelmRelease
metadata:
  name: prometheus-grafana
  namespace: flux-system
spec:
  targetNamespace: monitoring
  interval: 1m
  chart:
    spec:
      chart: kube-prometheus-stack
      version: "*"
      sourceRef:
        kind: HelmRepository
        name: prometheus-community
        namespace: flux-system
  install:
    createNamespace: true
  values:
    prometheus:
      service:
        nodePort: 30909
        type: NodePort
    grafana:
      service:
        type: NodePort
        nodePort: 30000
kubectl apply -f gitops/flux/prometheus-grafana.yaml
Enable Metrics on Kube-Scheduler
For security purposes, Kube-Scheduler is not accessible by default. So, metrics aren’t scraped, but if you are running tests and need to collect metrics from it, you need to bind the address and make it accessible to other pods like the Prometheus pod, etc.
docker exec -it kind-control-plane bash
apt update
apt install vim -y
vi /etc/kubernetes/manifests/kube-scheduler.yaml

spec:
  containers:
  - command:
    - kube-scheduler
    - --bind-address=0.0.0.0  # Allow listening on all interfaces
Now the Prometheus service monitor scraping metrics from the scheduler will be in an up state.
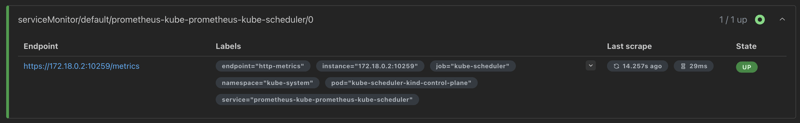
kube-scheduler service monitor
Grab the Grafana Username and Password
kubectl get secrets prometheus-grafana -o jsonpath='{.data.admin-password}' | base64 --decode ; echo
kubectl get secrets prometheus-grafana -o jsonpath='{.data.admin-user}' | base64 --decode ; echo
Scale the Deployment to 30 and Modify Node Affinity
Initially, I had one pod running in the deployment.
kubectl get deployments.apps nginx-deployment

NAME               READY   UP-TO-DATE   AVAILABLE   AGE
nginx-deployment   1/1     1            1           5s
Now, I’ll scale the deployment to 30. To do this, I will modify a copy of the deployment stored in the overlays directory.
├── gitops
│   └── kustomization
│       └── others
│           ├── base
│           └── overlays
│               └── modify-number-of-pods
│                   ├── deployment.yaml
│                   └── kustomization.yaml
I updated the replicas field and the values in the deployment file.
overlays/modify-number-of-pods/deployment.yaml
replicas: 30 # update this
...
affinity:
  nodeAffinity:
    requiredDuringSchedulingIgnoredDuringExecution:
      nodeSelectorTerms:
        - matchExpressions:
            - key: type
              operator: In
              values:
                - kwokkk # update this
...
The above manifest, updates the deployment to 30 pods, it also uses the wrong label value, so the pods are unschedulable.
I intentionally made them unschedulable so we can see some scheduler metrics in action.
Now, push your config to GitHub and wait for 60s, so Flux pulls and updates your cluster.
git commit -am "update deployment"
git push
sleep 60
kubectl get deployments.apps nginx-deployment

NAME               READY   UP-TO-DATE   AVAILABLE   AGE
nginx-deployment   0/30    30           0           16m
View Scheduler Metrics on Grafana Dashboard
Log into Grafana by visiting localhost:3000. The username and password you received may be this.
username = admin
password = prom-operator
Go to Menu > Dashboard > Kubernetes/Scheduler> Edit > Add > Visualization > Queries > Metrics
Add a metric to view all pending and unschedulable pods.
scheduler_pending_pods{queue="unschedulable"}
You should see a graph similar to this, telling you 30 pods are currently pending.
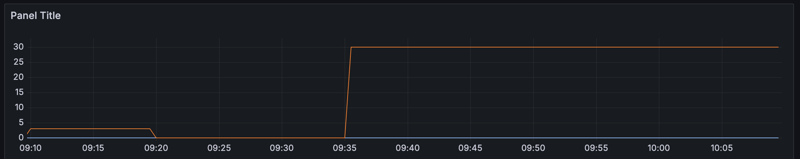
Prometheus metrics graph on Grafana dashboard
Conclusion
Now, we have learned how engineers and developers use GitOps to manage their KWOK deployment, collect metrics from the control-plane, and view them on Grafana. This method works on several other use-cases. In a public cloud’s managed Kubernetes clusters, the clusters control plane node is often restricted, however, the cloud provider exposes the Prometheus metrics to you. If you manage your own control plane node, then this article should help you learn to expose yours for testing.
- To find more control-plane uses cases for KWOK, see this GitHub issue.
- If you’d like an opportunity to intern in the Cloud Native Computing Foundation space, see the Linux Foundation Mentorship Program and Google Summer of Code.