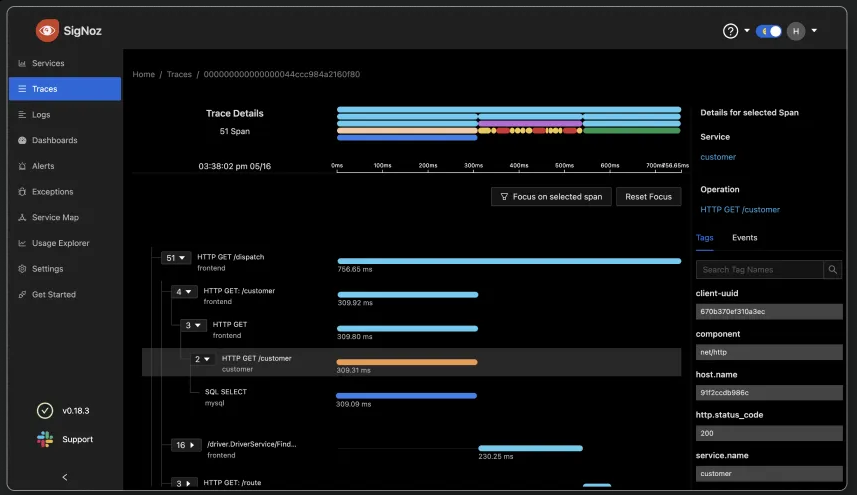
SigNoz is an open-source, full-stack observability platform that provides logs, metrics, and traces in a single application.
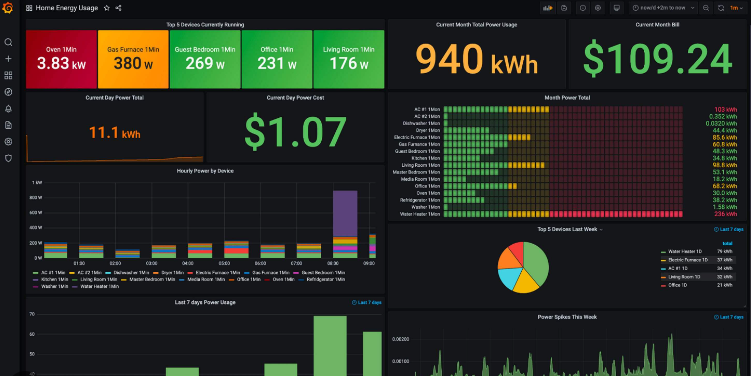
Grafana, on the other hand, started as a data visualization tool and has evolved into a comprehensive monitoring solution when combined with other tools in the Grafana stack. …………………………………………………………………………………………………………………………………………
Introduction
SigNoz is an open-source, full-stack observability platform that provides logs, metrics, and traces in a single application. Grafana, on the other hand, started as a data visualization tool and has evolved into a comprehensive monitoring solution when combined with other tools in the Grafana stack.


Key Differences
Architecture
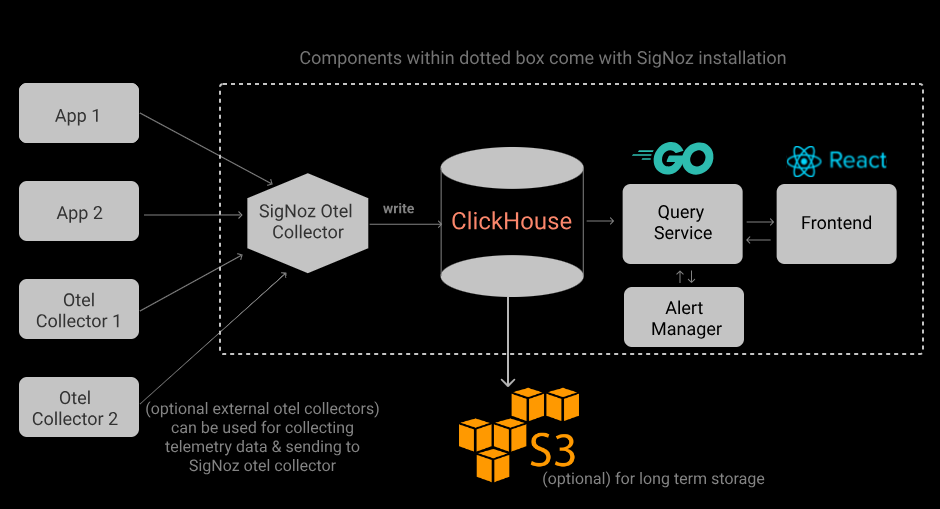
SigNoz is built as a single application to handle logs, metrics, and traces, using ClickHouse as its backend database.
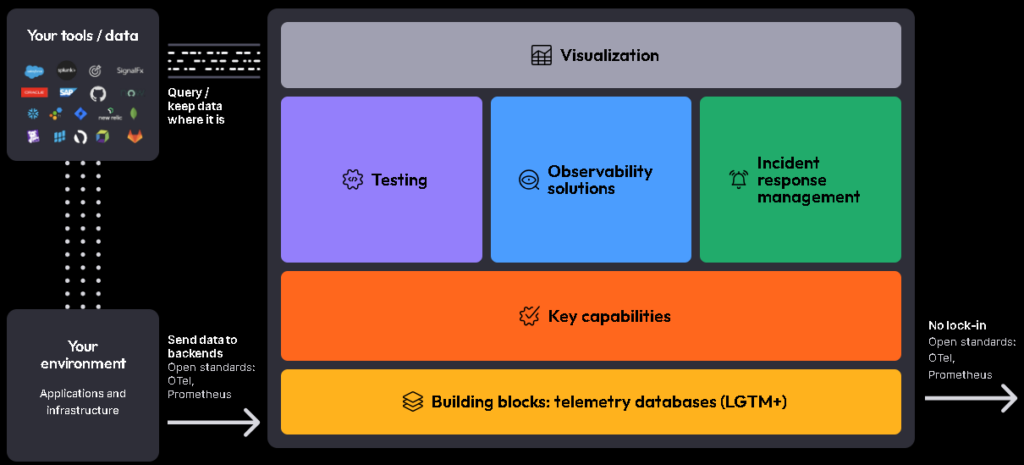
Grafana relies on multiple backend tools:
- Loki for logs
- Tempo for traces
- Mimir for metrics
This architectural difference impacts ease of setup and maintenance.


OpenTelementry Support
SigNoz is OpenTelemetry-native, built to support this open standard from day one.
While Grafana also supports OpenTelemetry, it uses different backends for different signal types.
Data Handling
SigNoz uses ClickHouse, a columnar database known for fast ingestion and aggregation.
Grafana’s Loki, designed for log management, may struggle with high-cardinality data.
Self-Hosting
SigNoz is generally easier to self-host compared to Grafana, which requires managing multiple backends and configurations
Feature Comparison
| Feature | SigNoz | Grafana |
| Open Source |  |
               |
| Analytics on High Cardinality Data |                |
       |
| Logs, Metrics, Traces |                |
               |
| APM |                |
               |
| Alerts |                |
               |
| Single Backend |                |
       |
| Open Telemetry Visualization |                |
       |
| Exceptions Monitoring |        |
       |
| Synthetic Monitoring |        |
               |
| Incident Response |                |
               |
Code Snippets
SigNoz
Steps to Install and Try SigNoz Locally:
Installation Steps
- Clone the SigNoz repository:
git clone -b main https://github.com/SigNoz/signoz.git
cd signoz/deploy/- You have two options for installation:
Run the install script:
Option 1: Using the install script (Recommended for macOS and some Linux distributions)
Run the install script:
./install.shThis script will check your environment, install Docker Engine and Docker Compose on Linux if needed, and run the docker compose up command for you.
Option 2: Using Docker Compose manually
If you prefer to run Docker Compose yourself or are using a Linux distribution not supported by the install script:
docker compose -f docker/clickhouse-setup/docker-compose.yaml up -d3 : Wait for the installation to complete. You can check the status of the containers using:
docker ps4 : Once all containers are up and running, you can access the SigNoz dashboard by opening a web browser and navigating to:
http://localhost:3301Using SigNoz
With SigNoz installed, you can now instrument your applications to send telemetry data to SigNoz. You’ll need to use OpenTelemetry libraries for your specific programming language to send data to SigNoz.
For example, to instrument a Node.js application, you would:
- Install the OpenTelemetry packages
- Configure the OpenTelemetry SDK to send data to your local SigNoz instance
- Instrument your code with OpenTelemetry
Stopping and Starting SigNoz
To stop SigNoz:
docker compose -f docker/clickhouse-setup/docker-compose.yaml stopTo start/resume SigNoz:
docker compose -f docker/clickhouse-setup/docker-compose.yaml up -dUpgrading SigNoz
To upgrade to the latest version:
git checkout main
git pull origin main
cd deploy && ./install.sh
Uninstalling SigNoz
To completely remove SigNoz and its data:
docker compose -f docker/clickhouse-setup/docker-compose.yaml down -v
Remember to refer to the official SigNoz documentation for the most up-to-date instructions and troubleshooting tips
Use Cases
Choose SigNoz if:
- You want a single tool for logs, metrics, and traces
- OpenTelemetry support is crucial
- You need analytics on high-cardinality data
- Easy self-hosting is a priority
Choose Grafana if:
- You require highly customizable dashboards
- You need synthetic monitoring
- Incident response features are essential
- You’re already using other Grafana stack components
Performance
SigNoz has shown better performance in log ingestion and querying, especially for high-cardinality data.
Grafana’s Loki may struggle in such scenarios.
Pricing
SigNoz offers free unlimited user seats, while Grafana charges per active user. This can make SigNoz more cost-effective for larger teams.
Community and Support
Both tools have active open-source communities. SigNoz boasts over 14,000 GitHub stars and a growing contributor base.
Grafana has a larger, more established community due to its longer presence in the market.
Conclusion
SigNoz and Grafana both offer powerful observability solutions, but with different strengths. SigNoz excels in providing a unified, OpenTelemetry-native platform with strong performance on high-cardinality data.
Grafana offers unparalleled visualization capabilities and a mature ecosystem of tools. Your choice should depend on your specific needs, existing infrastructure, and team preferences.
References
https://signoz.io/docs/introduction
https://grafana.com/docs/grafana/latest
https://signoz.io/docs/userguide/manage-dashboards
https://grafana.com/docs/grafana-cloud
SigNoz Documentation: https://signoz.io/docs/
GitHub Repository: https://github.com/SigNoz/signoz