Migrating from Heroku to Kubernetes is no small feat. While Heroku provided a straightforward Platform-as-a-Service (PaaS) environment that handled many operational aspects for us, Kubernetes offers greater flexibility, scalability, and control. However, with great power comes great responsibility and a host of new challenges. In this post, I will share the key lessons we learned during our migration and how we tackled common hurdles along the way.
1. Probe Issue: Cloudflare Errors
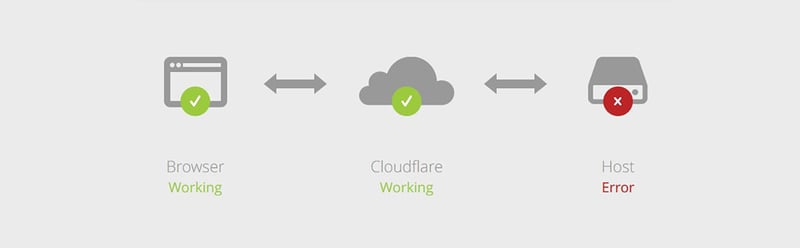
After migrating to Kubernetes, we encountered Cloudflare error messages reported by users. These errors would disappear after refreshing the page, but they were persistent. Our investigation traced the issue back to our deployment configuration.
The way our pods were deployed prevented Cloudflare from properly verifying pod health, leading to timeouts.
How We Fixed It
Implementing Pod Probes: We added both readiness and liveness probes in Kubernetes to ensure that traffic was only routed to healthy pods.
Enhancing Resilience: This setup enabled Kubernetes to automatically restart unhealthy pods, preventing downtime.
Here is a sample YAML configuration for readiness and liveness probes:
apiVersion: apps/v1
kind: Deployment
metadata:
  name: my-app
spec:
  replicas: 3
  template:
    spec:
      containers:
      - name: my-app-container
        image: my-app:latest
        ports:
        - containerPort: 8080
        readinessProbe:
          httpGet:
            path: /health
            port: 8080
          initialDelaySeconds: 5
          periodSeconds: 10
        livenessProbe:
          httpGet:
            path: /health
            port: 8080
          initialDelaySeconds: 15
          periodSeconds: 20
The readiness probe ensures the pod is ready to accept traffic, while the liveness probe restarts it if it becomes unresponsive.
For a more detailed breakdown, check out my full blog post: Sherlock Holmes and the Case of the Cloudflare Timeout Mystery.
2.Retrieving Real User IPs
Another issue we encountered was losing access to real user IP addresses after migrating to Kubernetes. Instead of seeing user IPs, our logs displayed the pod proxy IP, making it difficult to track users or manage logs effectively.
Solution
By setting the externalTrafficPolicy to Local, Kubernetes ensures that the real client IP is passed to your services, even when traffic is routed through a load balancer.
Here is a sample configuration:
apiVersion: v1
kind: Service
metadata:
  name: my-app-service
spec:
  selector:
    app: my-app
  ports:
    - port: 80
      targetPort: 8080
  type: LoadBalancer
  externalTrafficPolicy: Local
This configuration restores the real client IP by routing traffic only to local nodes.
For a step by step breakdown, read my blog post: Sherlock Holmes and the Case of the Missing User IPs.
3.Zombie State Issue: Servers Becoming Unresponsive

An unexpected challenge we faced was servers entering a “zombie” state. After running smoothly for days, some servers became unresponsive without any clear cause.
Our Fix: A Scheduled Restart
Despite extensive troubleshooting, we could not pinpoint the root cause. However, implementing a cron job to restart the servers every 24 hours effectively mitigated the issue.
Here is how we configured it using Kubernetes’ CronJob resource:
apiVersion: batch/v1
kind: CronJob
metadata:
  name: restart-my-server
spec:
  schedule: "0 0 * * *" # Runs every day at midnight
  jobTemplate:
    spec:
      template:
        spec:
          containers:
          - name: restart-container
            image: my-app:latest
            command: ["sh", "-c", "echo Restarting server... && kill -HUP 1"]
          restartPolicy: OnFailure
This ensures a daily restart, keeping our services responsive.
4.Securing Internal Service Communication
A major advantage of Kubernetes is the ability to restrict internal service visibility for security reasons. We wanted to prevent all services from being externally accessible while still allowing internal communication.
Solution
We leveraged Kubernetes’ internal DNS system, which allows services to communicate securely within the cluster.
For example, a service in the my-namespace namespace can be accessed using:
my-service.my-namespace.svc.cluster.local
This setup isolates critical services, reducing the attack surface and enhancing security.
5.Setting Up Alerts: Proactive Monitoring
Without proper alerting, issues like crash loops or unexpected pod restarts can go unnoticed until they cause major downtime.
We implemented Prometheus and Alertmanager to notify us when:
- A pod enters a crash loop
- CPU or memory usage spikes above thresholds
Here is a Prometheus alerting rule to detect crash loops:
groups:
- name: crash-loop-alerts
  rules:
  - alert: PodInCrashLoop
    expr: kube_pod_container_status_restarts_total{job="kubelet",container="my-app"} > 5
    for: 5m
    labels:
      severity: critical
    annotations:
      summary: "Pod {{ $labels.pod }} in namespace {{ $labels.namespace }} is in a crash loop"
This alert triggers when a container restarts more than five times within five minutes.
6.Optimizing Node Utilization with Taints and Tolerations
To efficiently allocate resources, we used taints and tolerations to control pod placement on nodes.
For example, we applied a taint to a node to prevent certain pods from being scheduled on it:
kubectl taint nodes node1 key=value:NoSchedule
To allow specific pods to run on the tainted node, we added this toleration:
spec:
  tolerations:
  - key: "key"
    operator: "Equal"
    value: "value"
    effect: "NoSchedule"
This strategy ensured high-resource pods were assigned to powerful nodes while lightweight pods ran on less resource-intensive ones, optimizing cluster performance.
Wrapping Up
Migrating from Heroku to Kubernetes came with its challenges, but each hurdle made our system stronger. With better scalability, resilience, and control, the shift was well worth it. If you are on a similar journey, embrace the learning curve it pays off.
Have insights or questions? Let’s discuss.