Kubernetes has revolutionized the way we deploy and manage applications. However, with this power comes the responsibility of ensuring that your applications are running smoothly. Monitoring and logging are critical components of Kubernetes management that provide visibility into the performance and health of your applications. In this guide, we will explore the essentials of Kubernetes monitoring and logging, the tools available, and best practices for effective observability.
Understanding the Importance of Monitoring and Logging
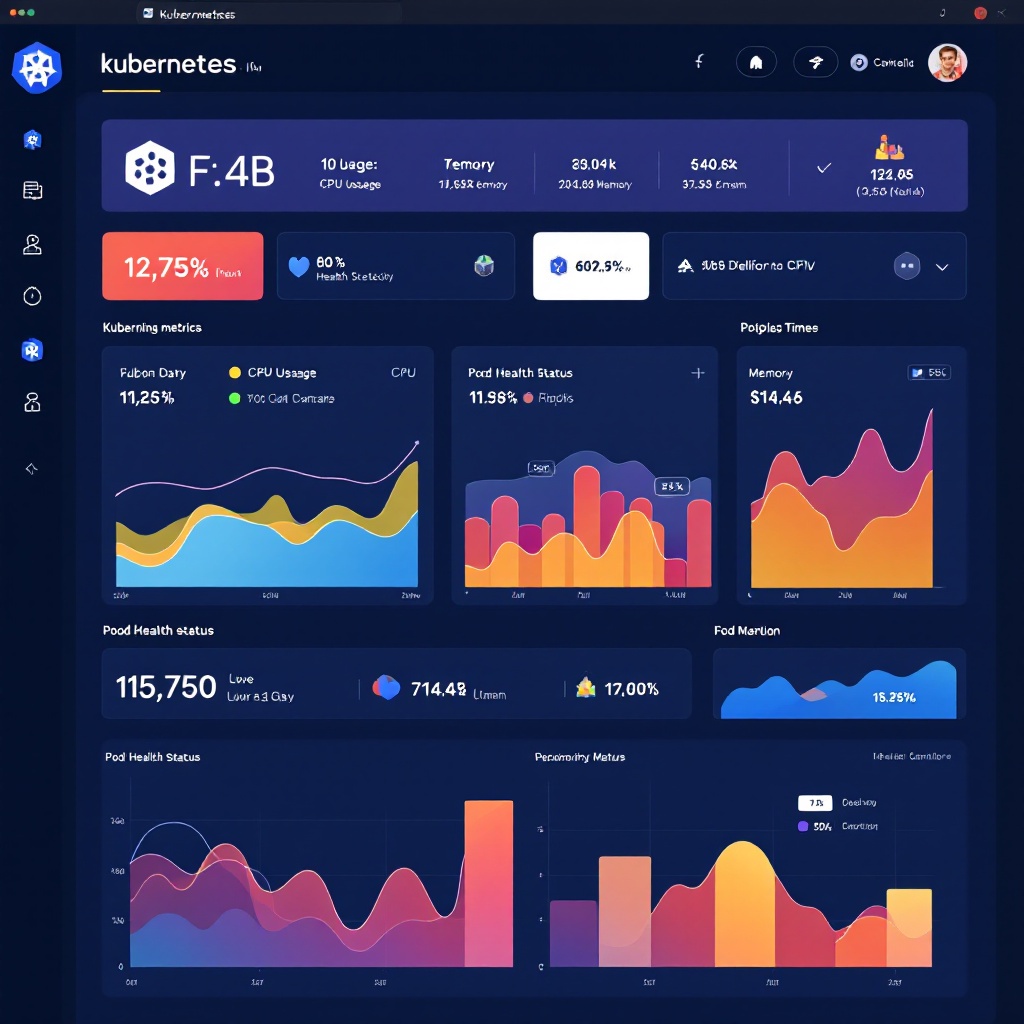
Monitoring is the process of collecting, analyzing, and using information about your system to improve its performance and enhance its availability. In Kubernetes, monitoring allows you to track the health of your nodes, pods, and services. Logging, on the other hand, involves capturing and storing logs generated by your applications and the Kubernetes components themselves. Together, these practices enable you to diagnose issues, optimize performance, and maintain a reliable service for your users.
Key Metrics to Monitor in Kubernetes
When it comes to monitoring Kubernetes, there are several key metrics you should keep an eye on:
- Node Metrics: CPU and memory usage, disk I/O, and network traffic are essential metrics that help you understand the overall health of your Kubernetes nodes.
- Pod Metrics: Monitor the status of your pods, including their resource usage and restart counts, to ensure that your applications are running as expected.
- Service Metrics: Track response times, error rates, and request counts for your services to identify performance bottlenecks.
Tools for Kubernetes Monitoring
There are numerous tools available for monitoring Kubernetes. Here are some of the most popular options:
- Prometheus: An open-source monitoring system that collects metrics from configured targets at specified intervals. It is widely used in the Kubernetes ecosystem for its powerful querying language and alerting capabilities.
- Grafana: Often used in conjunction with Prometheus, Grafana provides a beautiful and flexible dashboarding solution for visualizing metrics.
- Kube-state-metrics: This service generates metrics about the state of Kubernetes objects, such as deployments, nodes, and pods, which can be consumed by Prometheus.
- Elasticsearch, Fluentd, and Kibana (EFK) Stack: This trio works together to provide powerful logging and visualization capabilities. Fluentd collects logs from your applications and sends them to Elasticsearch, which stores them, while Kibana provides a powerful interface for visualizing and searching logs.
Best Practices for Effective Monitoring
To make the most of your monitoring efforts, consider the following best practices:
- Define SLOs and SLIs: Establish Service Level Objectives (SLOs) and Service Level Indicators (SLIs) to set clear expectations for performance and availability. This helps you measure success and identify areas for improvement.
- Utilize Alerts: Set up alerts for critical metrics to be notified of potential issues before they impact your users. Use tools like Alertmanager with Prometheus to handle alert notifications effectively.
- Implement Dashboards: Create dashboards that visualize key metrics for your applications and infrastructure. Grafana can help you create custom dashboards that provide real-time insights into your system’s performance.
- Log Aggregation: Centralize your logging by using a log aggregation tool like Fluentd or Logstash. This makes it easier to search and analyze logs from multiple sources.
- Regularly Review Metrics: Continuously review your monitoring setup and adjust your metrics, alerts, and dashboards as your applications evolve and grow.
Conclusion
Kubernetes monitoring and logging are essential practices that enable you to maintain the performance and reliability of your applications. By understanding the key metrics to monitor, utilizing the right tools, and following best practices, you can ensure that your Kubernetes environment remains healthy and responsive. As you become more familiar with these practices, you will gain deeper insights into your applications and be better equipped to tackle any challenges that arise.