In this post, we’re going to walk through how to instrument a React Native application to send data to any OpenTelemetry (OTel) backend over OTLP-HTTP. In a previous tutorial for CNCF, we showed how to do this using the OTel JavaScript (JS) packages. However, in this walkthrough, we will use the open source Embrace React Native SDK for a few key reasons:
- The official OTel packages require some tiptoeing when integrating them because React Native is not directly supported as a platform by the OpenTelemetry JS packages. The Embrace software development kit (SDK) was purpose-built to support React Native, which allows us to integrate the SDK without workarounds.
- The Embrace React Native SDK is built on top of Embrace’s native mobile SDKs for Android and iOS. This allows it to emit telemetry around crashes, memory issues, etc., that occur in the native code running in a mobile app. In other words, you get better visibility into mobile app issues by accessing context from both native and JS layers.
- Like the OTel SDK, the Embrace React Native SDK allows exporting data to any OTLP-HTTP endpoint. However, by also sending that data to Embrace, you can leverage the power of Embrace’s dashboard to gain further insights, which we’ll dig into at the end of this walkthrough.
For simplicity, we’ll focus on iOS in this walkthrough. This same flow will work for Android with some minor differences to the setup. (See Adding the React Native Embrace SDK and Getting Started with the Embrace Dashboard for more details.)
Installing Packages
This tutorial will leverage @react-native-community/cli, which is a set of command line tools that help you build React Native apps. In particular, we’ll use its init command to quickly get a blank app up and running:
At this point you should have the community’s Hello World example app running on iOS. Next, add the core Embrace SDK package as well as the @embrace-io/react-native-otlp package to allow export to an OTLP-HTTP endpoint:
Initializing the SDK
To initialize the SDK and configure it so that it points to your backend of choice (in this case, the Grafana Cloud OTLP endpoint), open App.tsx and add the following to the App functional component:
There are a few things happening in the above snippet, so let’s take a look at them one at a time:
- Initializing the Embrace SDK in JavaScript:
- We are using the
useEmbracehook to start and configure the Embrace SDK. This is the simplest way to get the Embrace SDK started from the React Native layer. Note that, because we’re dealing with a mobile app, there may be interesting telemetry to capture before starting the JS layer that we would miss out on with this approach. The Embrace SDK can also be started in native code to account for this scenario, but we won’t get into that level of detail in this tutorial. More information can be found in the documentation if you are interested.
- We are using the
- Configuring log and trace exporters:
- Logs and traces are two of the fundamental OTel signals. Here, we are setting both to be exported to the same backend. Note that the two exporters are configured independently of one another. If you wish, you could choose to set up just one, or you could send telemetry to different observability backend locations.
- Any backend that supports receiving data as OTLP-HTTP would work. In this example, we are choosing to use Grafana. If you don’t already have an appropriate backend setup, you can quickly get started with Grafana by registering to Grafana Cloud and creating an account. You may want to configure data sources like Tempo for traces or Loki for logs.
- We are also setting
disabledUrlPatternsin the iOS configuration to exclude any capture of URLs with the pattern["grafana.net"]. Embrace’s instrumentation automatically creates spans for any network requests. However, because the OTLP exporter makes a network request to send traces, this would produce a cycle where the export’s network request creates a span, which is exported and creates another span, and so on. Ignoring “grafana.net” allows us to export to it without creating additional telemetry.
- Grabbing
isPendingandisStartedfrom the result of using the hook:- We’ll use these values later on in the tutorial. They allow us to know when the Embrace SDK has successfully started so that we can build further instrumentation on top of it.
Reviewing the Automatic Instrumentation
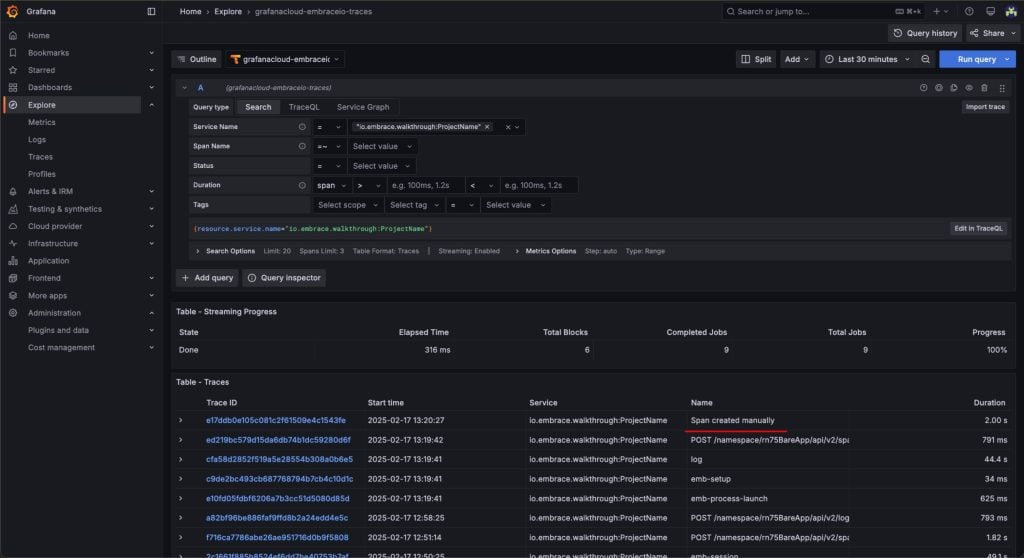
You haven’t yet added any instrumentation. However, you should still be able to see some useful telemetry in your observability system from the instrumentation that the Embrace SDK sets up automatically, such as capturing spans for network requests and logs for unhandled exceptions. To see these, relaunch the app and search in your observability tool for the new spans.
If you are using Grafana, you can log in to your Organization, select your Grafana Cloud stack and see some telemetry in the Explore section. Let’s dig into what you’ll see at this point:
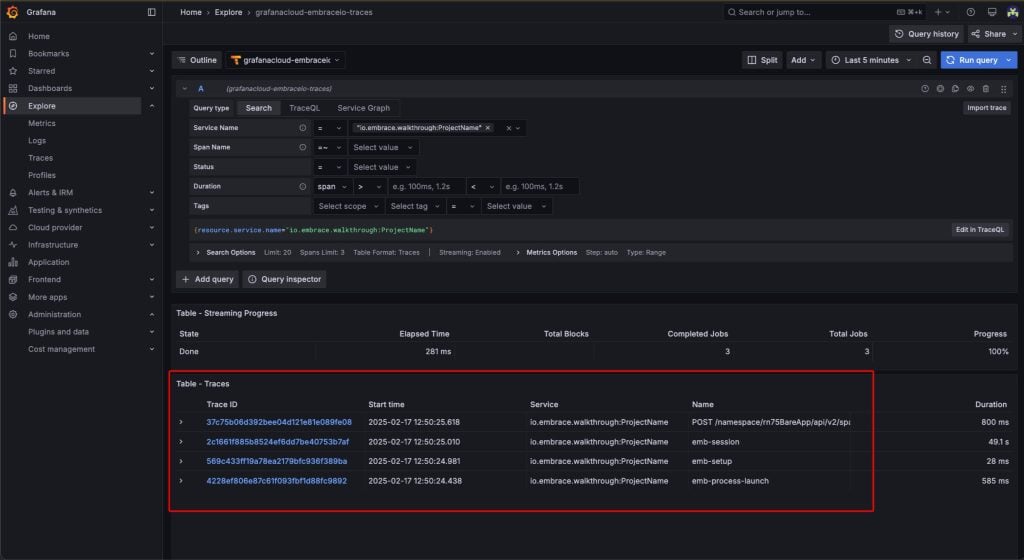
The above screenshot shows the very first spans created and exported by the application. If you click on one of the Trace ID values, the right panel will display and show the details for the span.
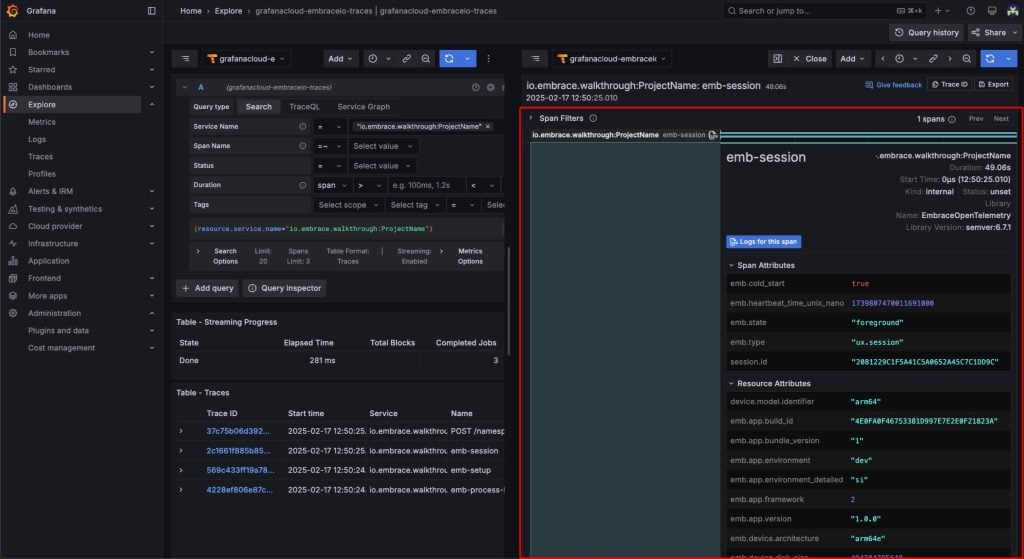
The screenshot above displays the emb-session trace, which contains a lot of interesting information about what we call a “session.” In the OTel Semantic Conventions, sessions are defined as “the period of time encompassing all activities performed by the application and the actions executed by the end user.”
By scrolling down in the side panel on the right, you can see even more information that is collected by default for every app session.
Adding Manual Tracing
You can add your own custom tracing as well. In OpenTelemetry, this is done through a Tracer Provider, so start by adding Embrace’s tracer provider package, which implements this interface. Setting this up could look like:
In this snippet, the Embrace tracer provider is initialized and used to create a new custom span with the createSpan call. The tracer is used to start the span manually, and then at a certain point in the business logic, the span should be ended.
For testing purposes, we are using a timeout to end the span here, but a more interesting case would be to wrap some extended operation and end the span whenever the action it measures is complete. Notice that we are also setting a custom attribute and event to this instance in order to attach further context to the span.
You are now ready to assign that callback to a button and test it, which can be rendered simply as:
Once you trigger this action, you can take a look back at the Grafana dashboard. You should see something like the following:
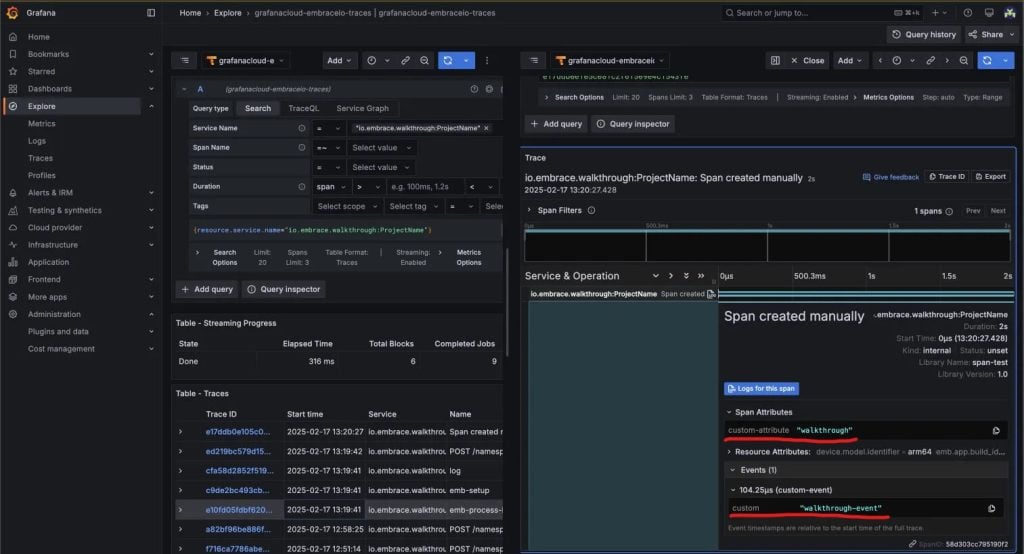
The span named Span created manually shows up in the list.
If you dig into this trace, you will see the custom attribute and event attached to it:
Adding Instrumentation for Navigation
A more realistic app will support navigating between screens, which is likely something you will also want to record telemetry for. Embrace has a package that provides the instrumentation for this common use case. This package takes in the same tracer provider that you set up in the previous steps and wraps your components in order to create telemetry whenever the user navigates to a new screen:
Your app should now launch with a tab bar that has two items, with screens that look like this:
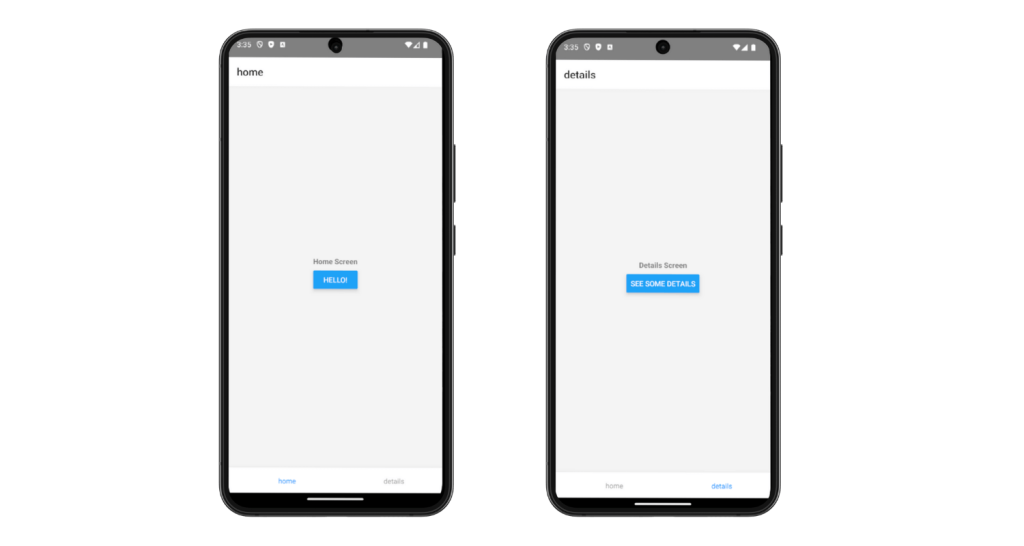
This example shows a very simple navigation flow using the @react-navigation/native package between a home page and a details screen, but it also supports the packages expo-router and react-native-navigation.
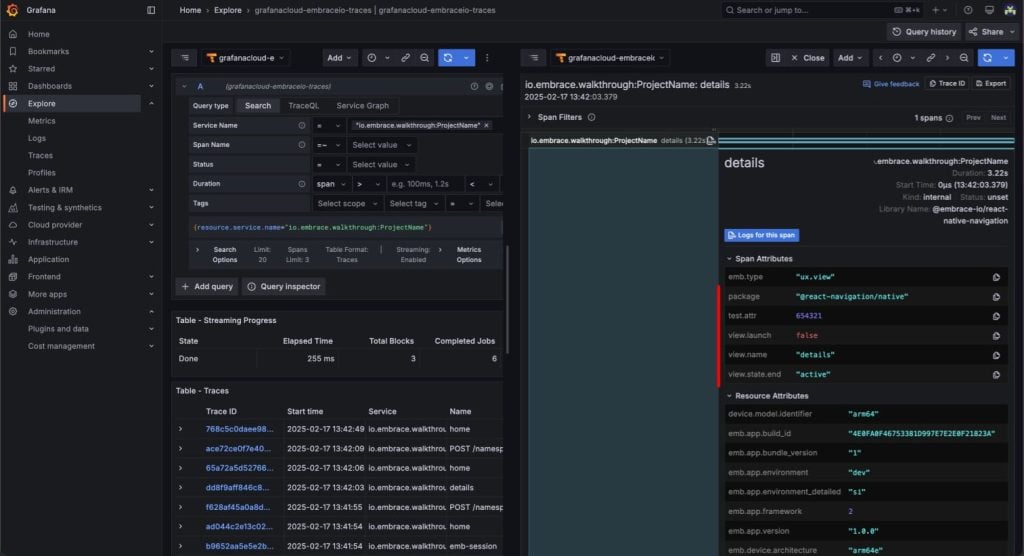
Now that this is all configured, you can build the application again and navigate between views. Every time a view shows up and then disappears (because another one is present), it will create a span that represents the period that the first view was displayed to the user.
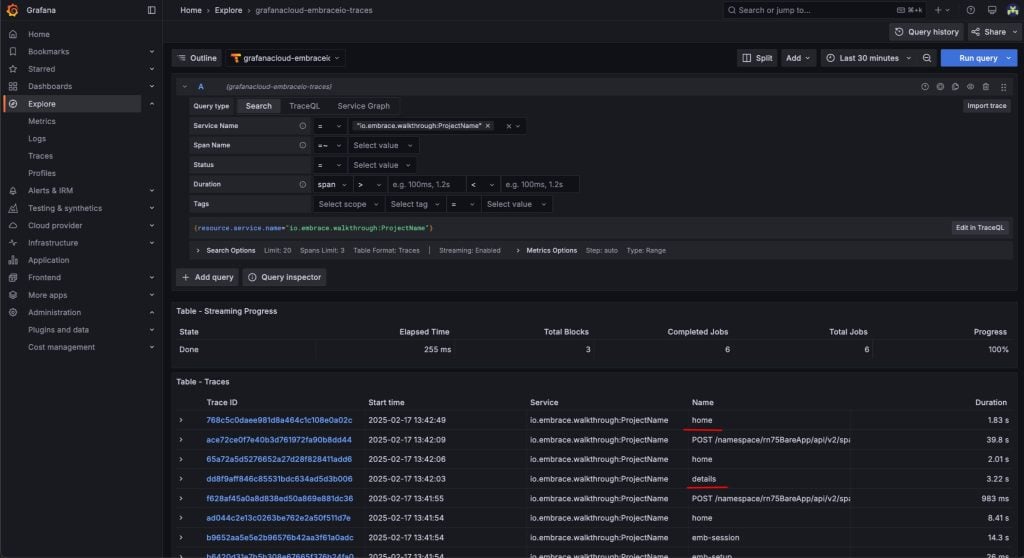
There are now two new names in this list — home and details. These two spans were created by the Embrace package, which captures every navigation action in the application once the package has been configured.
Looking closely at one of these new spans, you can see that the package not only adds a few default attributes such as view.name or view.state.end, but also includes the attributes you configured earlier through the screenAttributes property of the EmbraceNavigationTracker component:
The NavigationContainer component consumed from @embrace-io/react-native-navigation is what we call an “instrumentation library.” It is a stand-alone package that produces telemetry data referring to the navigation flow, and it automatically starts and ends spans at the right time with the appropriate context. You can read in depth about how we approached building it.
This instrumentation library is exposed by Embrace, but it’s not locked to our product. The same component could be used to track telemetry data using any tracer provider.
Likewise, any instrumentation library that works with a tracer provider and produces valid signals can be hooked up to Embrace to start capturing additional telemetry.
Gaining Valuable Insights With the Embrace Dashboard
The Embrace React Native SDK is a great option for quickly collecting valuable data to analyze user journeys and monitor the health of your applications across different devices. Embrace not only gathers this data for you but also provides a comprehensive set of tools to help you derive meaningful insights by processing all the signals collected by the SDK.
These include a powerful User Timeline showing exact sequences of events that led to an issue or poor customer experience:
The User Timeline allows developers to see what occurred in code from the user perspective (e.g., taps and navigation), from the business logic (e.g., networking and instrumented spans), and from the app and device layer (e.g., memory warnings and crashes). Putting this information all in sequence allows developers to dig into the technical details affecting performance and correlate issues across the app’s stack.
In addition, you can easily integrate Embrace with your existing observability solution to power mobile SLOs (service level objectives) and create more cohesive workflows between DevOps/site reliability engineers (SREs) and mobile teams. One such example is network span forwarding, which makes it possible to trace the same request in the User Timeline and your backend monitoring service.
Wrapping Up
In this walkthrough, we covered how to instrument a React Native application to send data to any OTel backend over OTLP-HTTP. We used the Embrace React Native SDK because it is purpose-built for React Native and greatly simplifies the integration process over the OpenTelemetry JS packages. We also touched briefly on a few benefits in sending your OpenTelemetry signals to the Embrace dashboard.
Embrace is helping make OpenTelemetry work for mobile developers. We’ve built our iOS, Android and React Native SDKs on OTel while working with the community to improve the specification. If you want to learn more about how to leverage mobile observability built on OpenTelemetry, check out our open source repos or join our Slack community.
The post How To Instrument a React Native App To Send OTel Signals appeared first on The New Stack.
Comments are closed.