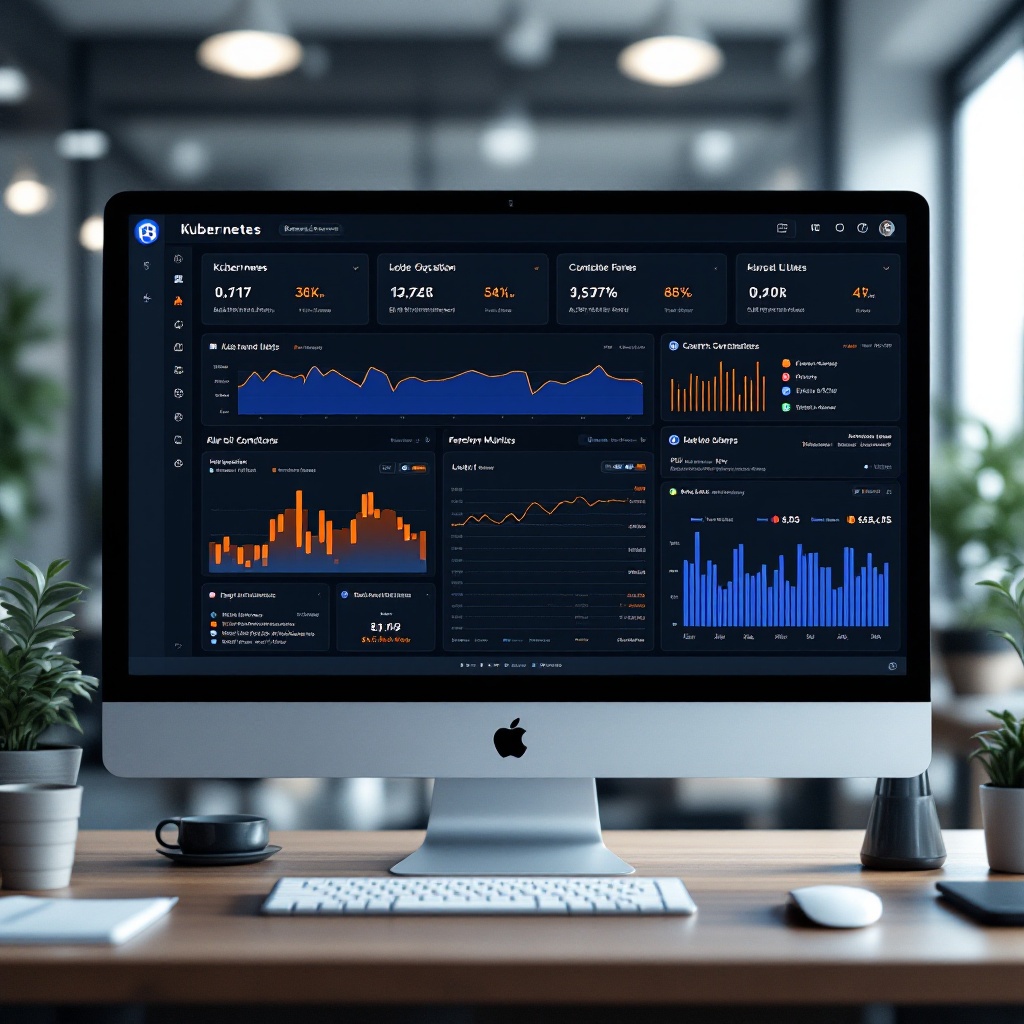
Kubernetes has become the go-to platform for container orchestration, enabling developers to deploy, scale, and manage applications seamlessly. However, one of the challenges Kubernetes users often face is monitoring their clusters efficiently. This is where a custom dashboard comes into play. In this tutorial, we will guide you step-by-step on how to build a custom Kubernetes dashboard that showcases metrics and logs for better monitoring.
Understanding the Importance of Monitoring
Before diving into the creation of your dashboard, it’s crucial to understand why monitoring is vital in Kubernetes environments. Monitoring allows you to gain insights into the performance and health of your applications. It helps identify bottlenecks, resource usage, and potential issues before they lead to outages. A well-designed dashboard can make these insights accessible and actionable.
Prerequisites
To build your custom Kubernetes dashboard, you’ll need the following prerequisites:
- A running Kubernetes cluster (you can use Minikube for local development).
- Basic understanding of Kubernetes concepts such as Pods, Services, and Deployments.
- Familiarity with tools such as Helm and kubectl.
- Access to a terminal and a text editor.
Step 1: Set Up Metrics Server
The first step in creating your custom dashboard is to set up the Metrics Server, which collects resource usage data from the Kubernetes API server.
kubectl apply -f https://github.com/kubernetes-sigs/metrics-server/releases/latest/download/components.yamlAfter deploying the Metrics Server, verify that it is running correctly:
kubectl get pods -n kube-systemStep 2: Install Grafana
Grafana is an open-source visualization tool that integrates seamlessly with Kubernetes. To install Grafana, you can use Helm:
helm repo add grafana https://grafana.github.io/helm-charts
helm repo update
helm install grafana grafana/grafana
Once installed, you can access Grafana through the following command:
kubectl port-forward svc/grafana 3000:80Navigate to http://localhost:3000 in your browser. The default login is username: admin and password: prom-operator.
Step 3: Configure Data Sources
After logging into Grafana, you’ll need to configure data sources. Click on the gear icon on the left sidebar and select ‘Data Sources’. Add Prometheus as a data source by providing the URL of your Prometheus instance. If you haven’t set up Prometheus yet, you can deploy it using Helm:
helm install prometheus prometheus-community/kube-prometheus-stackMake sure to configure Prometheus to scrape metrics from your Kubernetes cluster.
Step 4: Create Your Custom Dashboard
With your data sources configured, it’s time to create your custom dashboard. Click on the ‘+’ icon on the left sidebar and select ‘Dashboard’. Add a new panel and select the metrics you want to display. You can customize each panel’s visualization type, such as graphs, tables, or single stats depending on your needs.
Common metrics to include:
- CPU and Memory usage per Pod
- Node status and health
- Request and Response Times
- Custom application metrics
Step 5: Set Up Alerts
To ensure you are promptly notified of any issues, configure alerts for critical metrics. In Grafana, you can set up alerts within each panel. Define the conditions that trigger the alert, such as when CPU usage exceeds a certain threshold. You can receive notifications through various channels like email, Slack, or PagerDuty.
Step 6: Enhance Your Dashboard with Logs
For a comprehensive monitoring solution, consider integrating logs into your dashboard. You can use tools like Loki or Elasticsearch for log aggregation. Deploy Loki using Helm:
helm install loki grafana/lokiOnce deployed, configure Grafana to use Loki as a data source and create panels that visualize logs alongside metrics.
Conclusion
Building a custom Kubernetes dashboard can significantly enhance your monitoring capabilities, allowing you and your team to keep an eye on the health and performance of your applications. By leveraging tools like Grafana and Prometheus, you can create a dashboard that not only visualizes critical metrics but also provides valuable insights into logs and alerts. With this step-by-step guide, you are now equipped to build a robust monitoring solution tailored to your needs.
